
一、前言
因项目环境较多且需要监控展示,于是每个项目都要部署Grafana...而且这么多域名挺难记,新增项目也是如此重复性,emo中...,于是VictoriaMetrics 来了,采集的监控数据汇总到同一数据源,那我只要一个Grafana不就行了??想想就开心
#1.1 安装VictoriaMetrics
[root@manager prometheus]# cat vm.yaml
apiVersion: apps/v1
kind: Deployment
metadata:
name: victoria-metrics
namespace: kube-mon
spec:
selector:
matchLabels:
app: victoria-metrics
template:
metadata:
labels:
app: victoria-metrics
annotations:
prometheus.io/scrape: "true"
prometheus.io/port: "8428"
spec:
volumes:
- name: storage
persistentVolumeClaim:
claimName: victoria-metrics-data
- name: host-time
hostPath:
path: /etc/localtime
containers:
- name: vm
image: registry.cn-hangzhou.aliyuncs.com/s-ops/victoria-metrics:v1.91.3
imagePullPolicy: IfNotPresent
args:
- -storageDataPath=/var/lib/victoria-metrics-data # 数据持久化目录
- -retentionPeriod=30d # 数据存储时间
- -maxLabelsPerTimeseries=40 #标签限制数
ports:
- containerPort: 8428
name: http
volumeMounts:
- mountPath: /var/lib/victoria-metrics-data
name: storage
- name: host-time
mountPath: /etc/localtime
resources:
requests:
cpu: "500m"
memory: "1Gi"
limits:
cpu: "1000m"
memory: "2Gi"
---
apiVersion: v1
kind: Service
metadata:
name: victoria-metrics
namespace: kube-mon
spec:
type: NodePort
ports:
- port: 8428
selector:
app: victoria-metrics
1.2 promxy页面
因VictoriaMetrics的UI界面不是太友好,所以部署一个熟悉的Prometheus页面
[root@manager prometheus]# cat proxy-vm.yaml
# vm-promxy.yaml
apiVersion: v1
kind: ConfigMap
metadata:
name: promxy-config
namespace: kube-mon
data:
config.yaml: |
promxy:
server_groups:
- static_configs:
- targets: [victoria-metrics:8428] # 指定vm地址,有多个则往后追加即可
path_prefix: /prometheus # 配置前缀
---
apiVersion: apps/v1
kind: Deployment
metadata:
name: promxy
namespace: kube-mon
spec:
selector:
matchLabels:
app: promxy
template:
metadata:
labels:
app: promxy
spec:
containers:
- args:
- "--config=/etc/promxy/config.yaml"
- "--web.enable-lifecycle"
- "--log-level=trace"
env:
- name: ROLE
value: "1"
command:
- "/bin/promxy"
image: registry.cn-hangzhou.aliyuncs.com/s-ops/promxy:latest
imagePullPolicy: IfNotPresent
name: promxy
ports:
- containerPort: 8082
name: web
volumeMounts:
- mountPath: "/etc/promxy/"
name: promxy-config
readOnly: true
- mountPath: /etc/localtime
name: host-time
readOnly: true
- mountPath: /etc/timezone
name: host-timezone
- args: # container to reload configs on configmap change
- "--volume-dir=/etc/promxy"
- "--webhook-url=http://localhost:8082/-/reload"
image: registry.us-east-1.aliyuncs.com/y110/configmap-reload:v0.9.0
name: promxy-server-configmap-reload
volumeMounts:
- mountPath: "/etc/promxy/"
name: promxy-config
readOnly: true
volumes:
- configMap:
name: promxy-config
name: promxy-config
- name: host-time
hostPath:
path: /etc/localtime
- name: host-timezone
hostPath:
path: /etc/timezone
---
apiVersion: v1
kind: Service
metadata:
name: promxy
namespace: kube-mon
spec:
type: NodePort
ports:
- port: 8082
selector:
app: promxy
1.3 安装Prometheus HA模式
[root@manager prometheus]# cat prometheus-deploy.yaml
apiVersion: apps/v1
kind: Deployment
metadata:
name: prometheus
namespace: kube-mon
labels:
app: prometheus
spec:
replicas: 2 # 多副本
selector:
matchLabels:
app: prometheus
template:
metadata:
labels:
app: prometheus
spec:
serviceAccountName: prometheus
containers:
- image: registry.cn-hangzhou.aliyuncs.com/devops/prometheus:v2.31.1
name: prometheus
args:
- "--config.file=/etc/prometheus/prometheus.yml"
- "--storage.tsdb.path=/prometheus" # 指定tsdb数据路径
- "--storage.tsdb.retention.time=24h"
- "--web.enable-admin-api" # 控制对admin HTTP API的访问,其中包括删除时间序列等功能
- "--web.enable-lifecycle" # 支持热更新,直接执行localhost:9090/-/reload立即生效
ports:
- containerPort: 9090
name: http
volumeMounts:
- mountPath: "/etc/prometheus"
name: config-volume
- name: host-time
mountPath: /etc/localtime
resources:
requests:
cpu: 500m
memory: 1024Mi
limits:
cpu: 2000m
memory: 4096Mi
securityContext:
runAsUser: 0
volumes:
- configMap:
name: prometheus-config
name: config-volume
- name: host-time
hostPath:
path: /etc/localtime
远程写入" style="line-height: 1.25; font-size: 1.15rem; margin-top: -3.1rem; padding-top: 4.6rem; margin-bottom: 0px; color: rgb(0, 50, 60); font-family: -apple-system, BlinkMacSystemFont, "Segoe UI", Roboto, Oxygen, Ubuntu, Cantarell, "Fira Sans", "Droid Sans", "Helvetica Neue", sans-serif; text-wrap: wrap; background-color: rgb(255, 255, 255);">1.4 Prometheus开启远程写入
apiVersion: v1
kind: ConfigMap
metadata:
name: prometheus-config
namespace: kube-mon
data:
prometheus.yml: |
global:
scrape_interval: 30s
scrape_timeout: 15s
evaluation_interval: 30s
external_labels: # 根据项目定义labels,在vm中数据源区分
cluster: 'k8s-local'
remote_write: # 远程写入到远程 VM 存储
- url: http://victoria-metrics:8428/api/v1/write
rule_files:
- /etc/prometheus/rules.yml
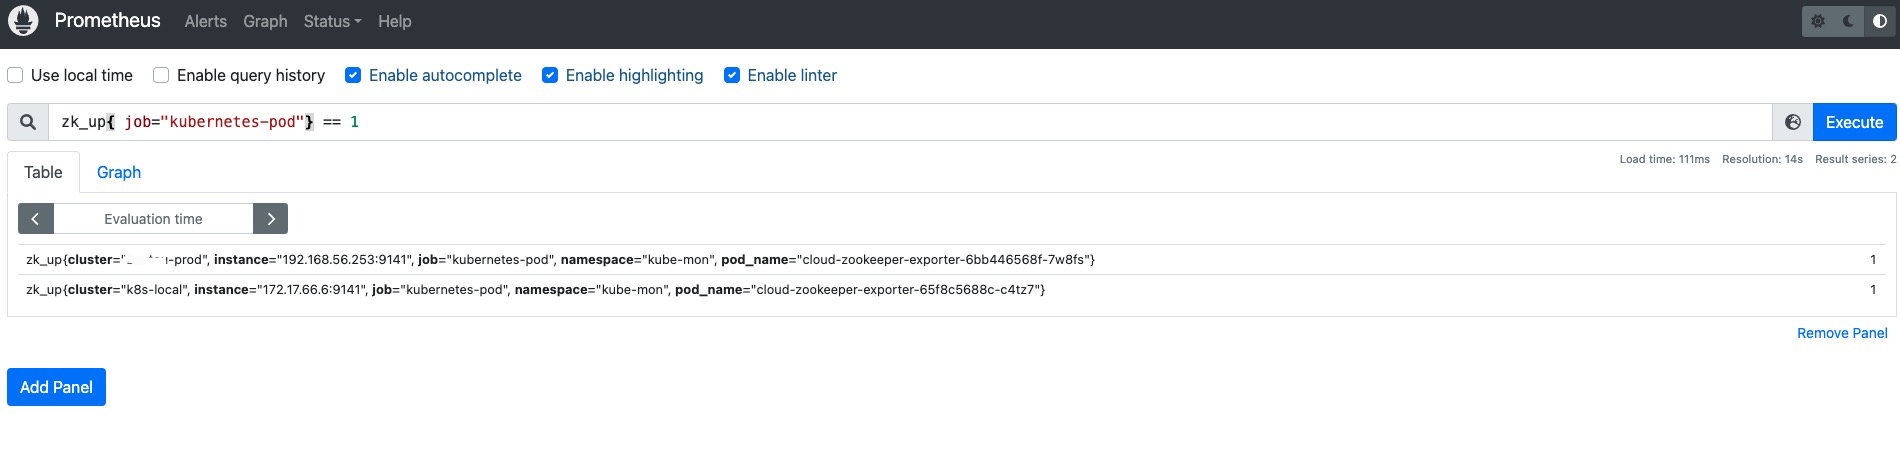
1.5 VictoriaMetrics查询验证
这边显示2个cluster标签的数据源,因为2个项目的监控数据写入同一个VictoriaMetrics
1.6 Prometheus写入VM
VictoriaMetrics端启用重复数据删除,重复数据删除后可减少磁盘空间使用量,官网 也有明确说明,使用-dedup.minScrapeInterval进行数据去重
[root@manager prometheus]# cat vm.yaml
apiVersion: apps/v1
kind: Deployment
metadata:
name: victoria-metrics
namespace: kube-mon
spec:
selector:
matchLabels:
app: victoria-metrics
template:
metadata:
labels:
app: victoria-metrics
annotations:
prometheus.io/scrape: "true"
prometheus.io/port: "8428"
spec:
volumes:
- name: storage
persistentVolumeClaim:
claimName: victoria-metrics-data
- name: host-time
hostPath:
path: /etc/localtime
containers:
- name: vm
image: registry.cn-hangzhou.aliyuncs.com/s-ops/victoria-metrics:v1.91.3
imagePullPolicy: IfNotPresent
args:
- -storageDataPath=/var/lib/victoria-metrics-data # 数据持久化目录
- -retentionPeriod=30d # 数据存储时间
- -maxLabelsPerTimeseries=40 #标签限制数
- -dedup.minScrapeInterval=30s # 数据去重
ports:
- containerPort: 8428
name: http
volumeMounts:
- mountPath: /var/lib/victoria-metrics-data
name: storage
- name: host-time
mountPath: /etc/localtime
resources:
requests:
cpu: "500m"
memory: "1Gi"
limits:
cpu: "1000m"
memory: "2Gi"
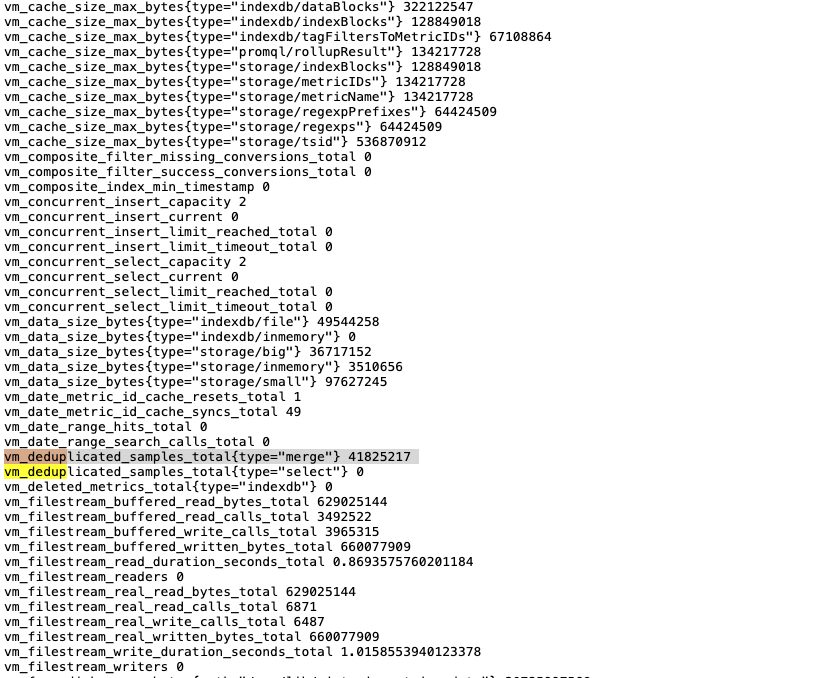
1.7 查看VictoriaMetrics的metrics指标
vm_deduplicated_samples_total{type="merge"}是VictoriaMetrics用于记录在数据合并过程中去重的样本数的指标
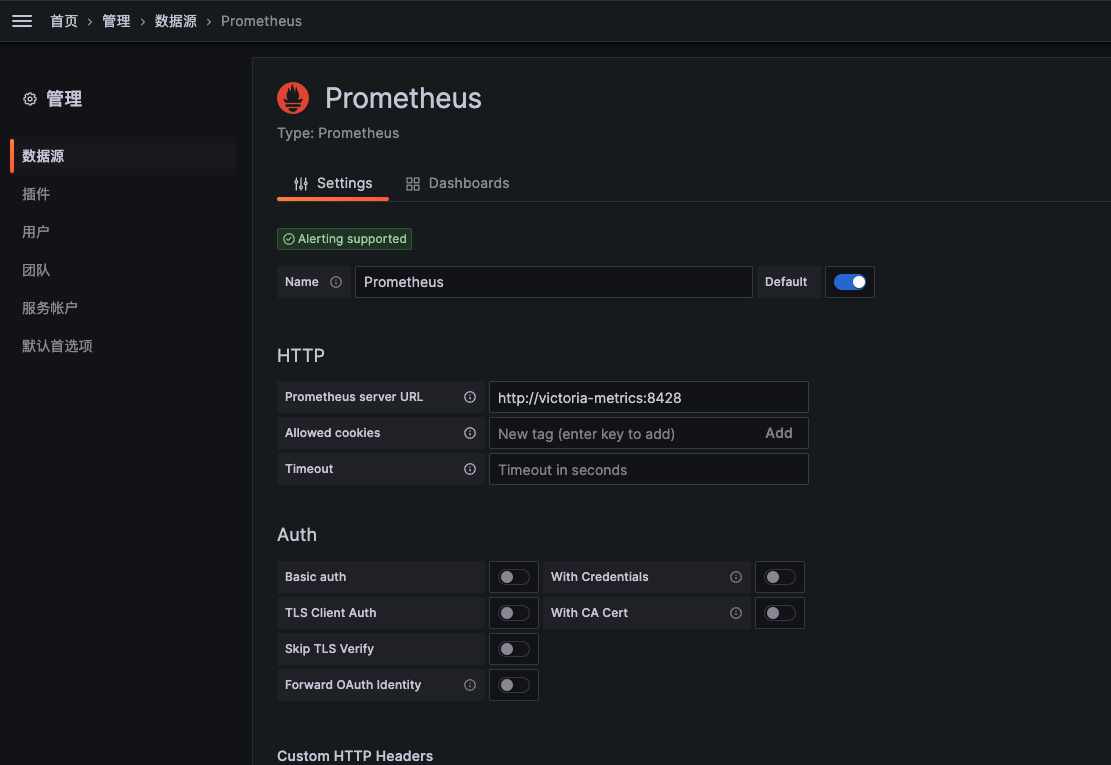
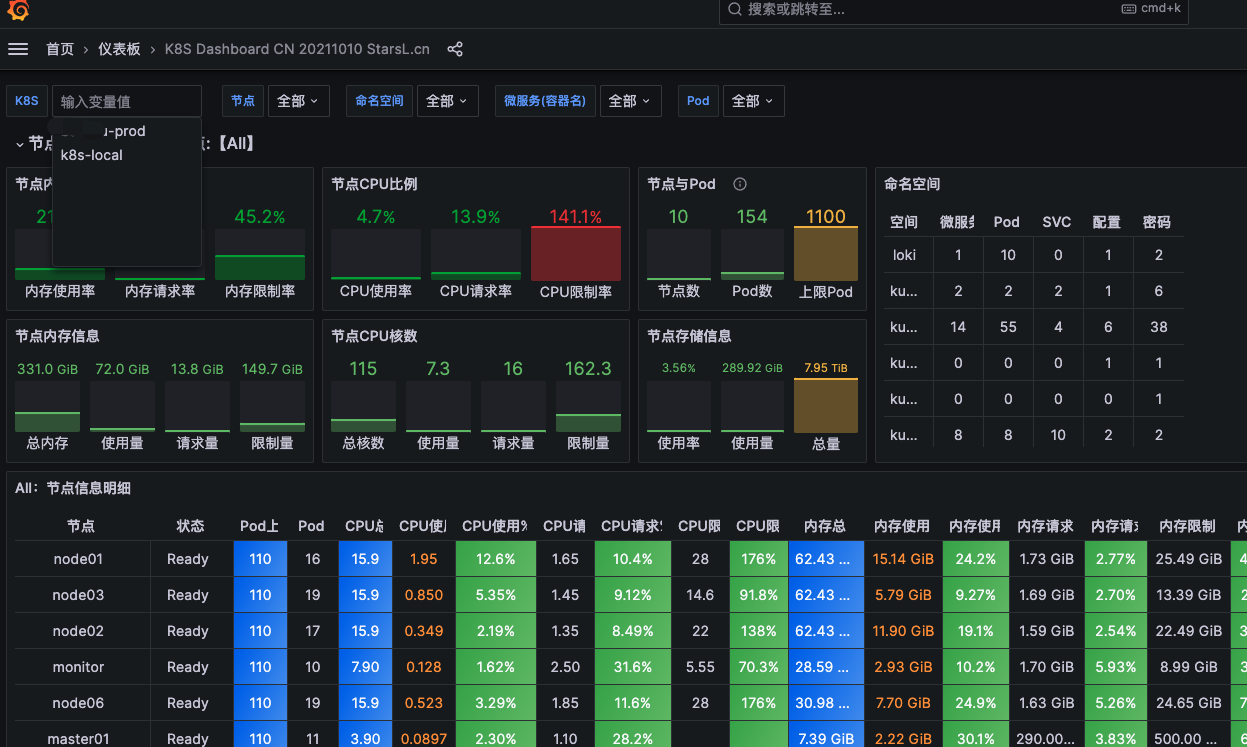
1.8 Grafana配置数据源
导入看板ID,按需更改就可以得到一个Grafana展示多集群
推荐本站淘宝优惠价购买喜欢的宝贝:
本文链接:https://hqyman.cn/post/7845.html 非本站原创文章欢迎转载,原创文章需保留本站地址!

 微信支付宝扫一扫,打赏作者吧~
休息一下~~